Marianna Carini

Email | LinkedIn | GitHub | Resume
I am currently a Sr. Analyst at Disneyland with 5+ years of experience in the Entertainment, Aerospace, and Sports industries.I have an MS degree in Business Analytics from UCI and BS in Mathematics from Cal Poly, SLO. I am passionate about solving complex problems in an eloquent manner!
Marianna Carini’s Portfolio
Netflix Stock Prediction
Project overview: In my Art of Forecasting course at UCI, we were assigned a Fortune 500 company and tasked to forecast their stock price on December 31st, 2021. I was assigned Netflix as my company.
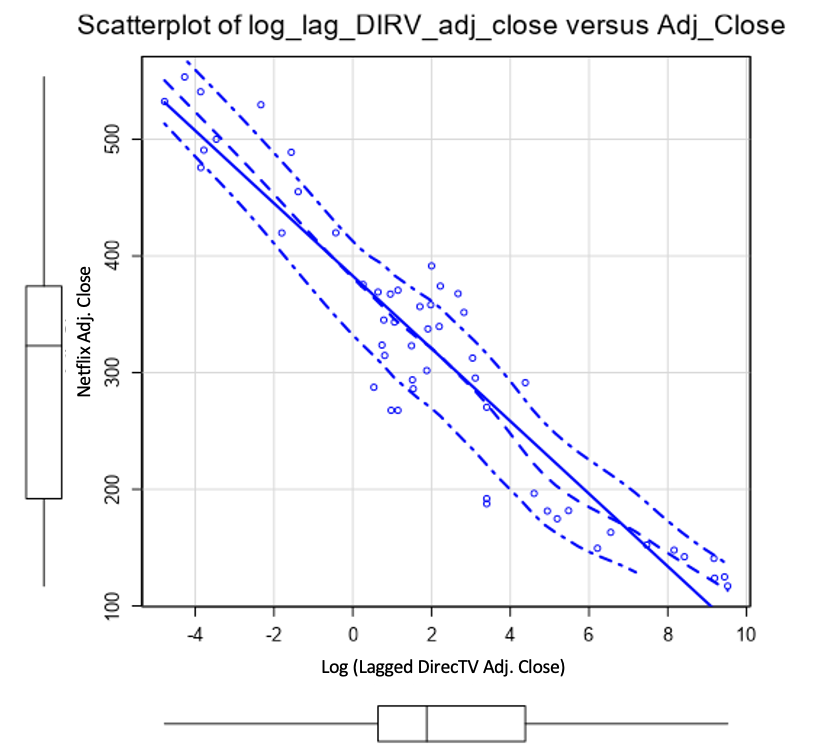
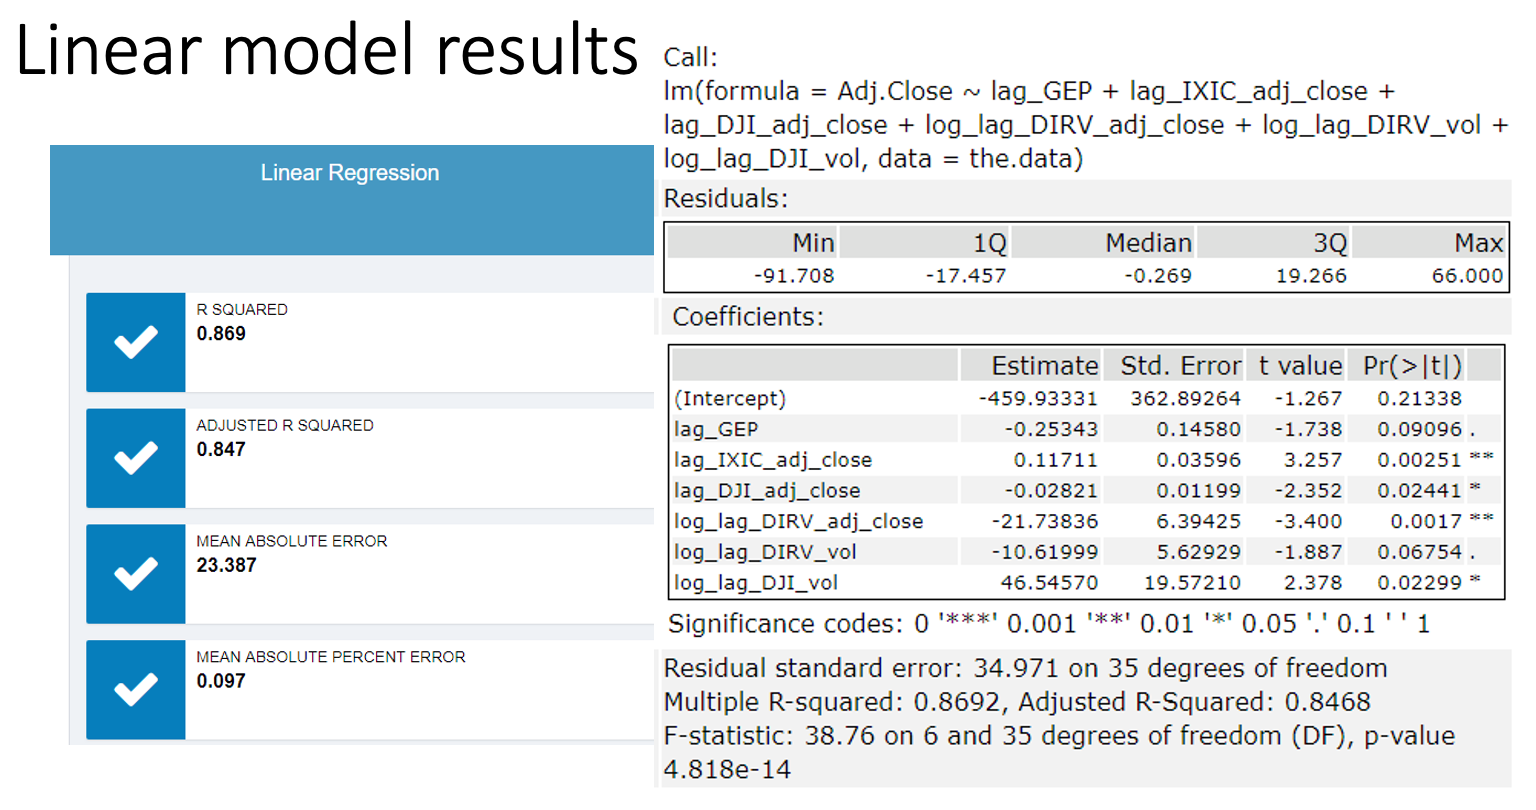
The dataset I created included historic stock prices, historic Netflix subscribers, market index values, and competitor stock values all on a monthly basis. From there I created an ARIMA model and an ETS model based on historic stock prices. Next, I created a linear regression model using lagged index and competitor stock values. I investigated various timeframes for lagging and picked the one with the best MAPE. In doing that, I found the lagged DirecTV stock value fit a near perfect negative line (image below). The final linear model performed at 0.869 R-squared. Lastly, I created a rolling 12-month average model, where I again studied various rolling values and 12 gave the best MAPE.
The outcome is an ensemble model based on weighted MAPE. At the time of my prediction, Netflix stock was trading at $553.41. From my model, I predicted the stock value to increase 33.22% to $690.11
Technical skills: ARIMA, ETS, regression
Tools: Alteryx, Excel
Extracting Insights on Medications From Drug Reviews
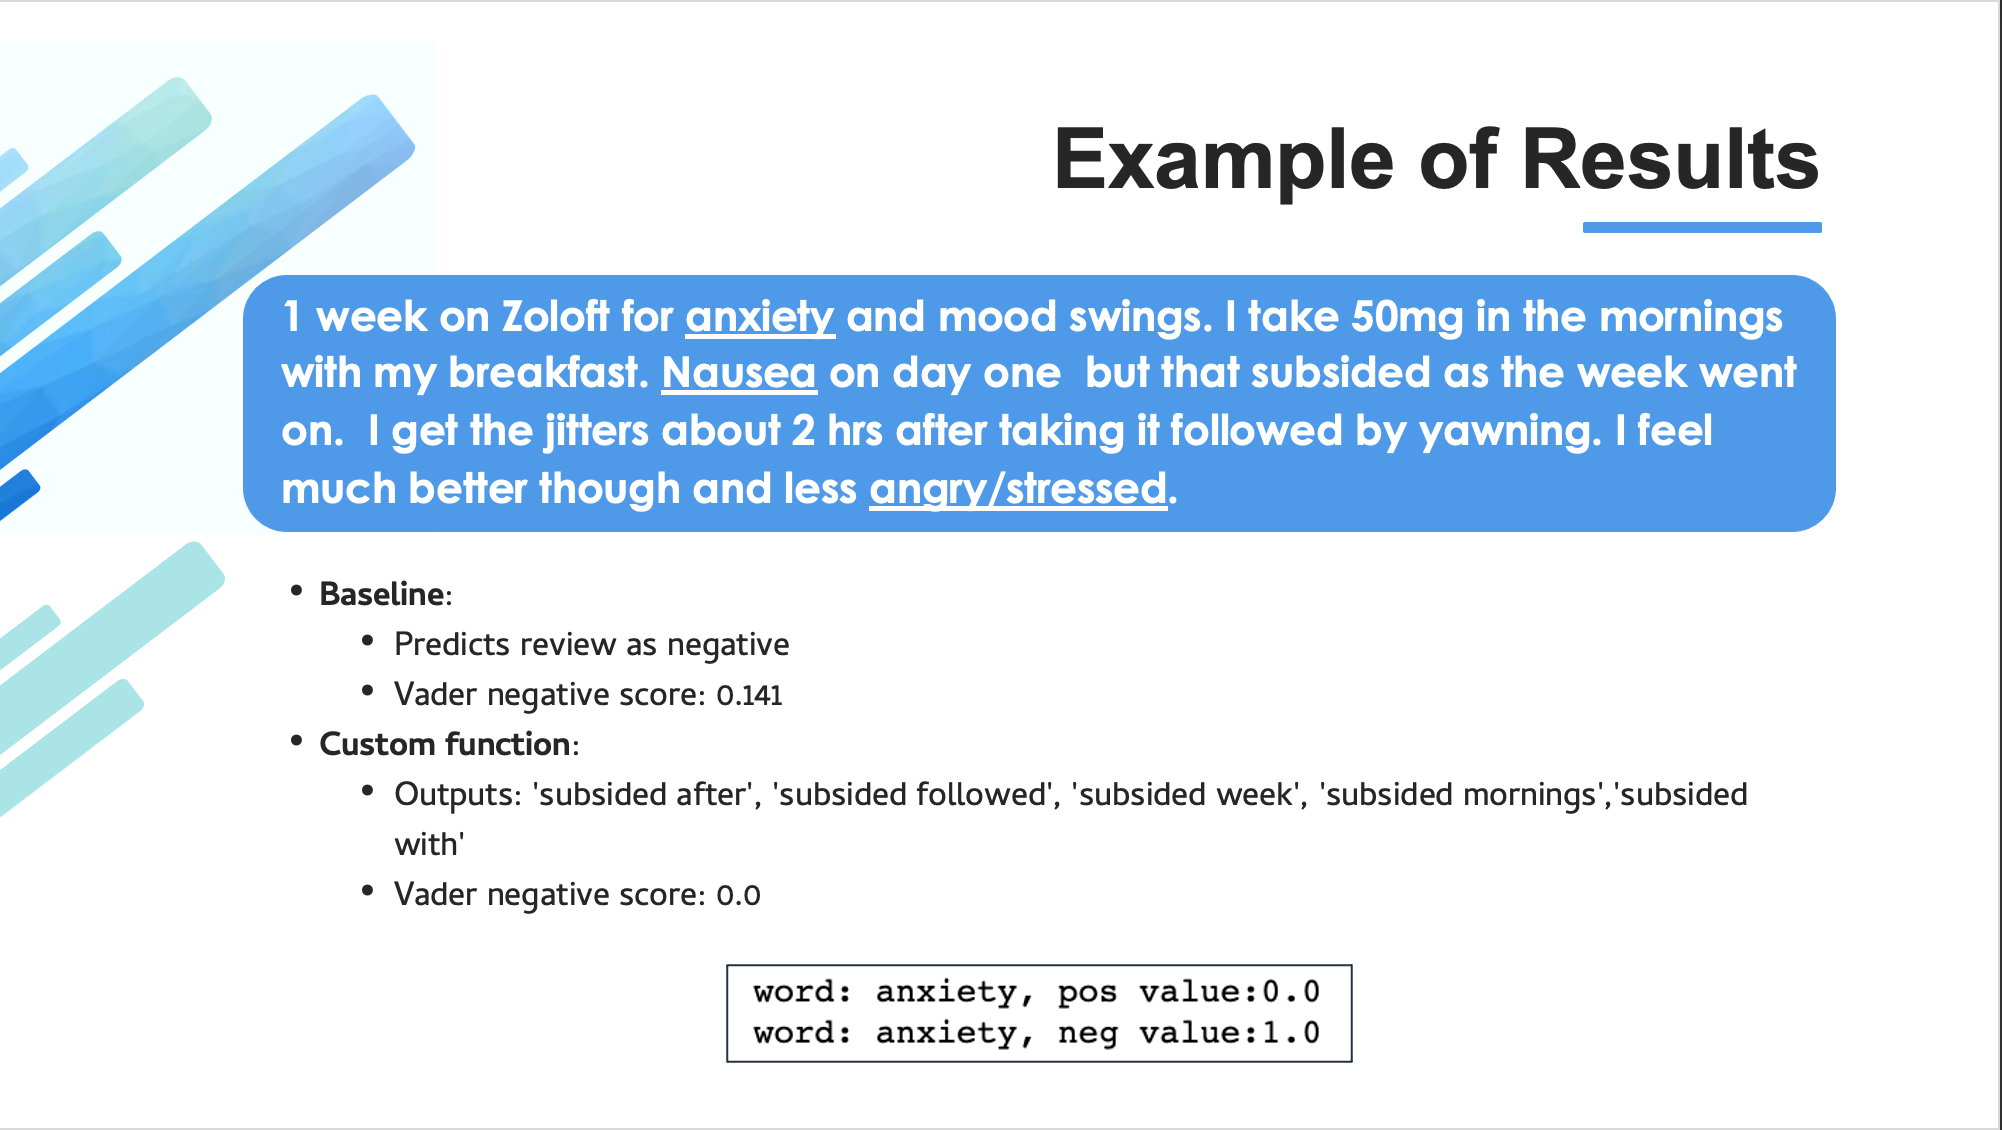
Project overview: Our group used the UCI Drug Review machine learning dataset with the goal of extracting insights for potential users. The challenge with this data is that medical conditions are inherently negative (i.e. cancer, headache, pain, etc.). Out of the box NLP packages, like vader and n-grams, will not be adequate in rating a text as positive or negative. With medication reviews, we need to separate the text pertaining to the medication from the text regarding the condition.
To do this, we created a list of key words relating to medications (ex. drug, cream, Advil, etc.) and utilized spaCy to identify words connected to our key words. The resulting function would take in the full review and return the significant tri-grams like, “decreased my nausea”. We could then use vader to classify whether that phrase was positive or negative. This gives the user/provider the ability to comb through thousands of reviews and analyze the significant phrases for the medication. Furthermore, this methodology could be implemented in other contexts such as customer service reviews, legal documents, etc..

Improvements: To further improve our custom medication tagging function, we could look at the optimal length from our keywords to give the right amount of context. We could also look into alternatives to spaCy like W2V.
Technical skills: Natural language processing, sentiment analysis
Tools: Python
Team: Karl Hickel, Caesar Phan, Byran Sam, Marianna Carini
Anaheim Ducks Capstone Project
Specifics and files are not shared for confidentiality purposes.
Project overview: As a part of the UCI MSBA program, students are required to complete a six month long capstone project with a local Orange County company. I was fortunate enough to be paired with the Anaheim Ducks Hockey Club along with four other students. The purpose of the project was to answer three questions:
• Who are Ducks customers?
• What drives the buying behaviors of Ducks customers?
• Is there any synergy between Ducks customers and customers within the H&S Ventures (the parent company) portfolio?
With the use of recency frequency monetization (RFM) scoring, we were able to identify a potential target customer segmentation that had not been specifically marketed to previously. To showcase these segments, we created a Tableau dashboard to display their demographics. Next, we used survival analysis to investigate drivers towards Ducks ticket sales and the effectiveness of various marketing methods. Our findings opened discussions towards a shift in marketing strategy from previous approaches. Lastly, we observed that Ducks customers prefer certain types of activities in the H&S portfolio. Our recommendation was to potentially increase the availability of these activities to attract more Ducks customers.
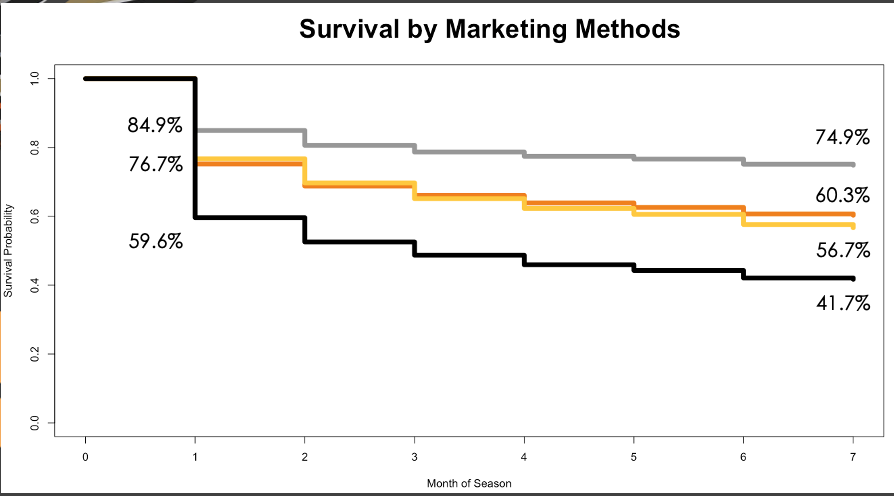
Improvements: From our analysis, we cannot say what is a cause and what is an effect; more specifically for the survival analysis piece of the project. The next step would be to set up a randomized experiment to draw more conclusive findings regarding the effectiveness of various marketing methods.
Technical skills: Survival analysis, RFM scoring, clustering, multivariate regression, SVM, KNN, decision tree, random forest
Tools: R, SQL, Tableau
Team: Salem Arthur, Eric Chen, Edward Shih-Chung, Marianna Carini
Specifics and files are not shared for confidentiality purposes.
Super Bowl LV Score Prediction
Project overview: As a part of my Art of Forecasting course, we were asked to forecast the final score of Super Bowl LV. We were assigned teams where each member would contribute at least one forecast and the final result would be one ensembled score.
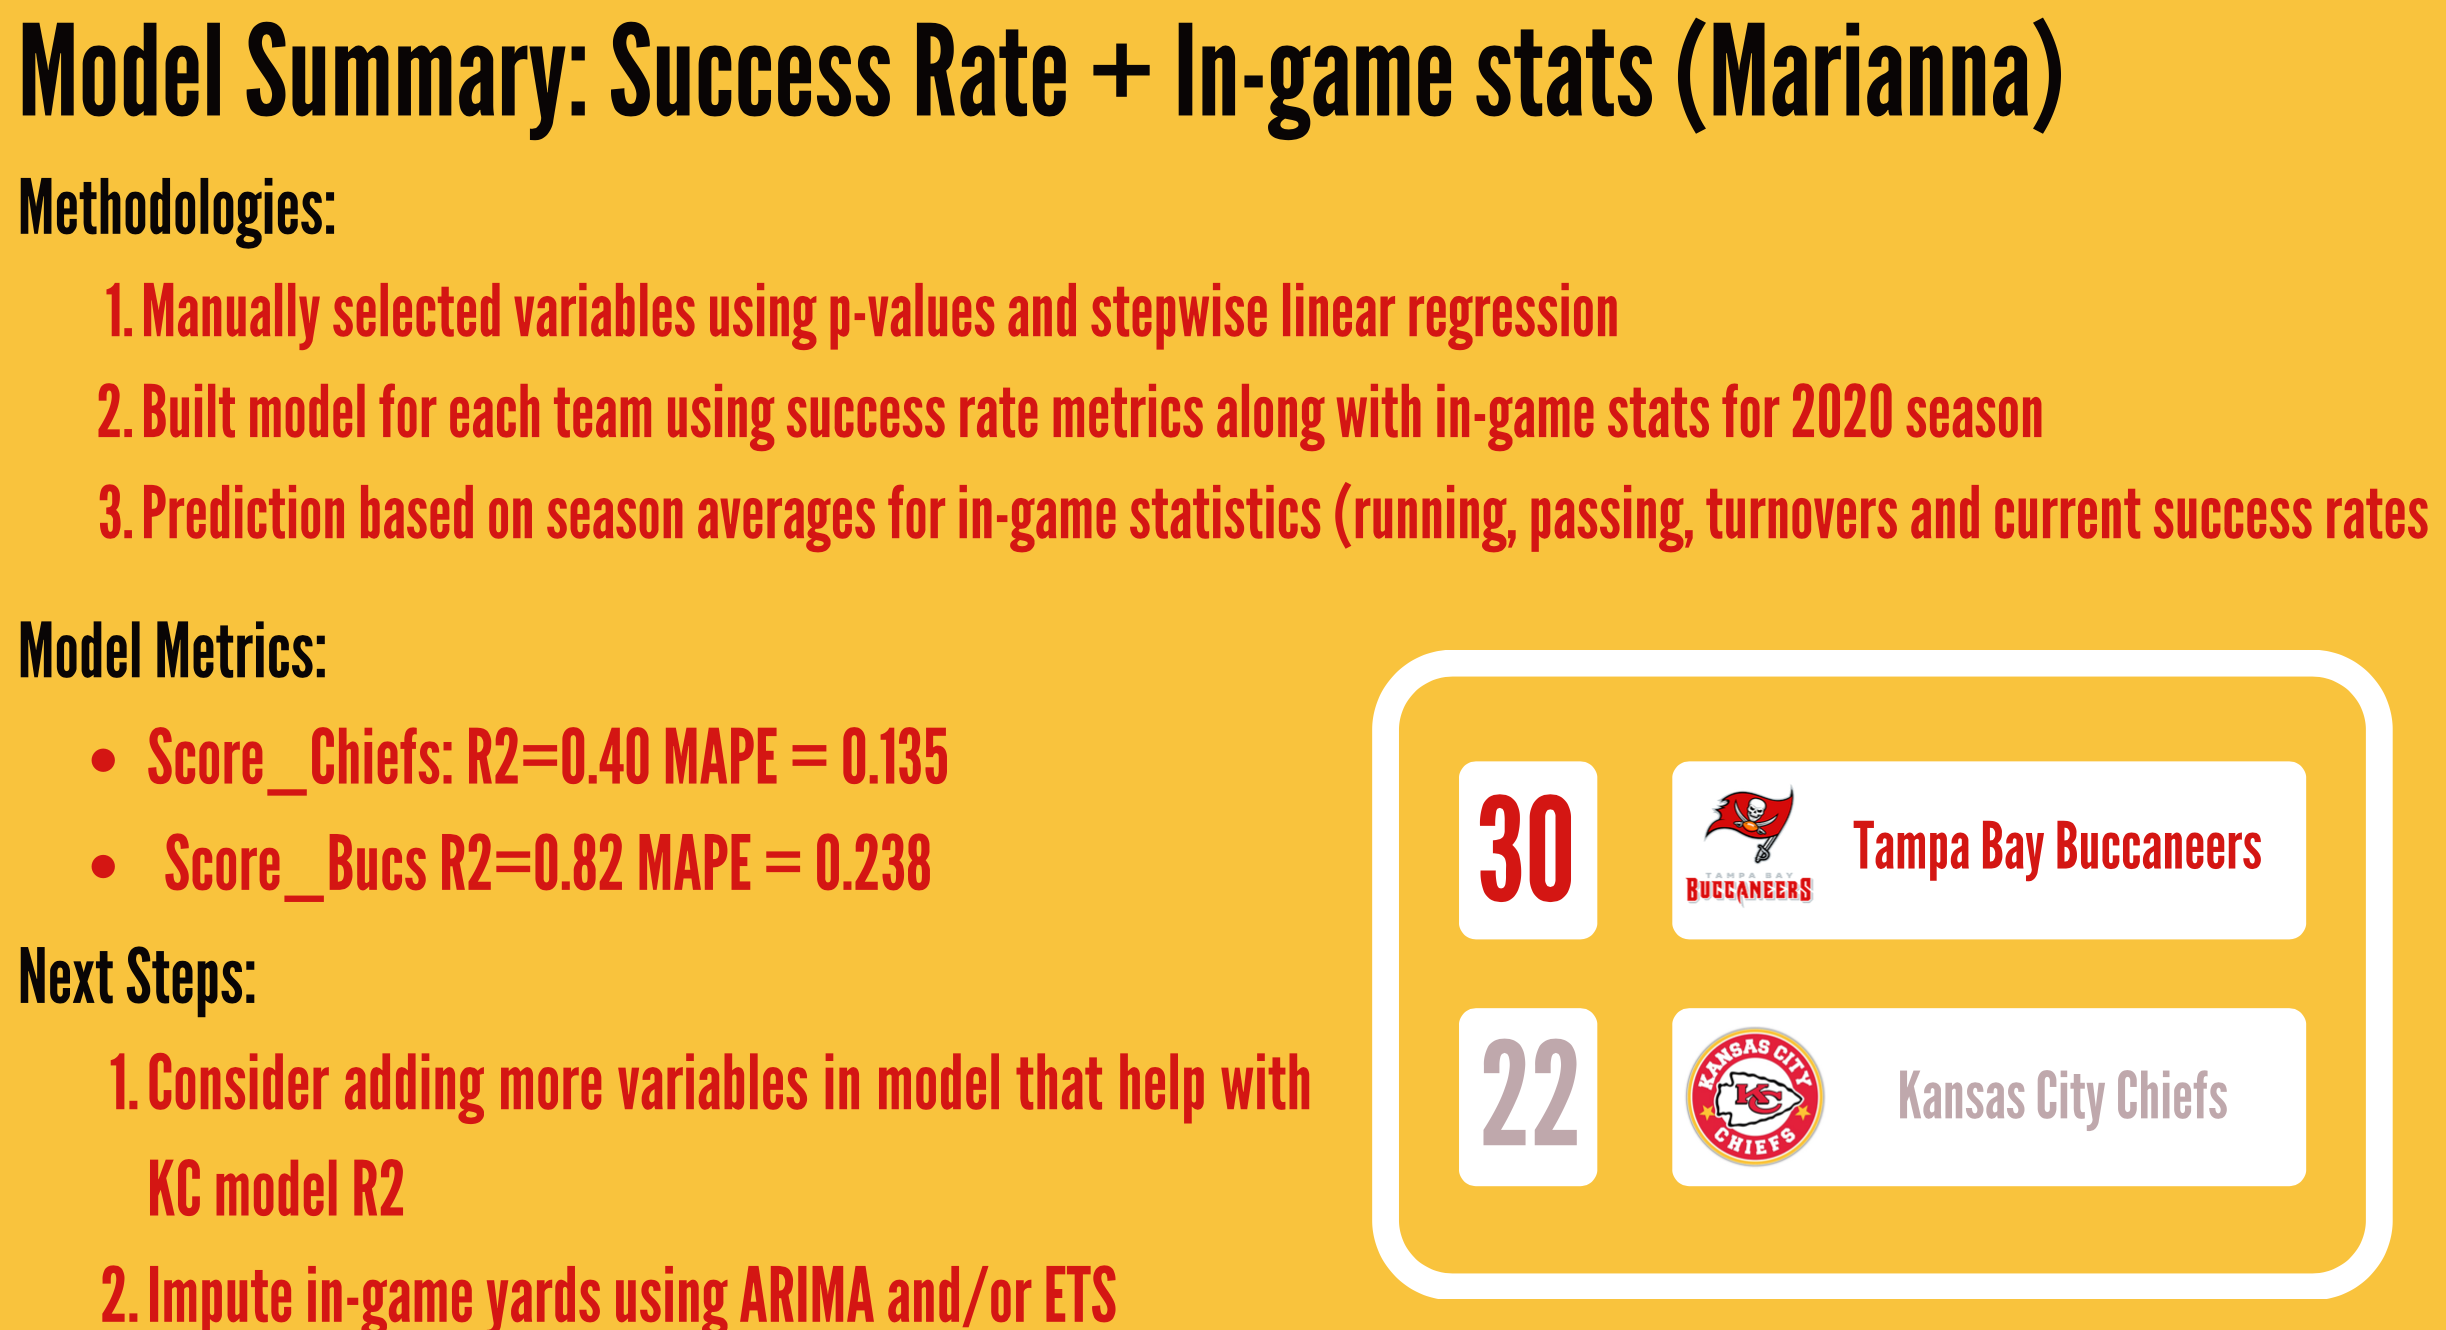
For my piece, I submitted three models to the group. My first model was based on success rate metrics (passing success rate, running success rate, etc.) as well as season averages for in-game statistics (rushing yards, turnovers, etc.). I manually selected my variables based on p-values and stepwise linear regression. The model was run for Tampa Bay and Kansas City separately. The resulting score was 30 to 22 Tampa Bay. My second model was similar to my first model, however it only used success metrics and no in-game metrics. That model predicted 34 to 29 Tampa Bay.
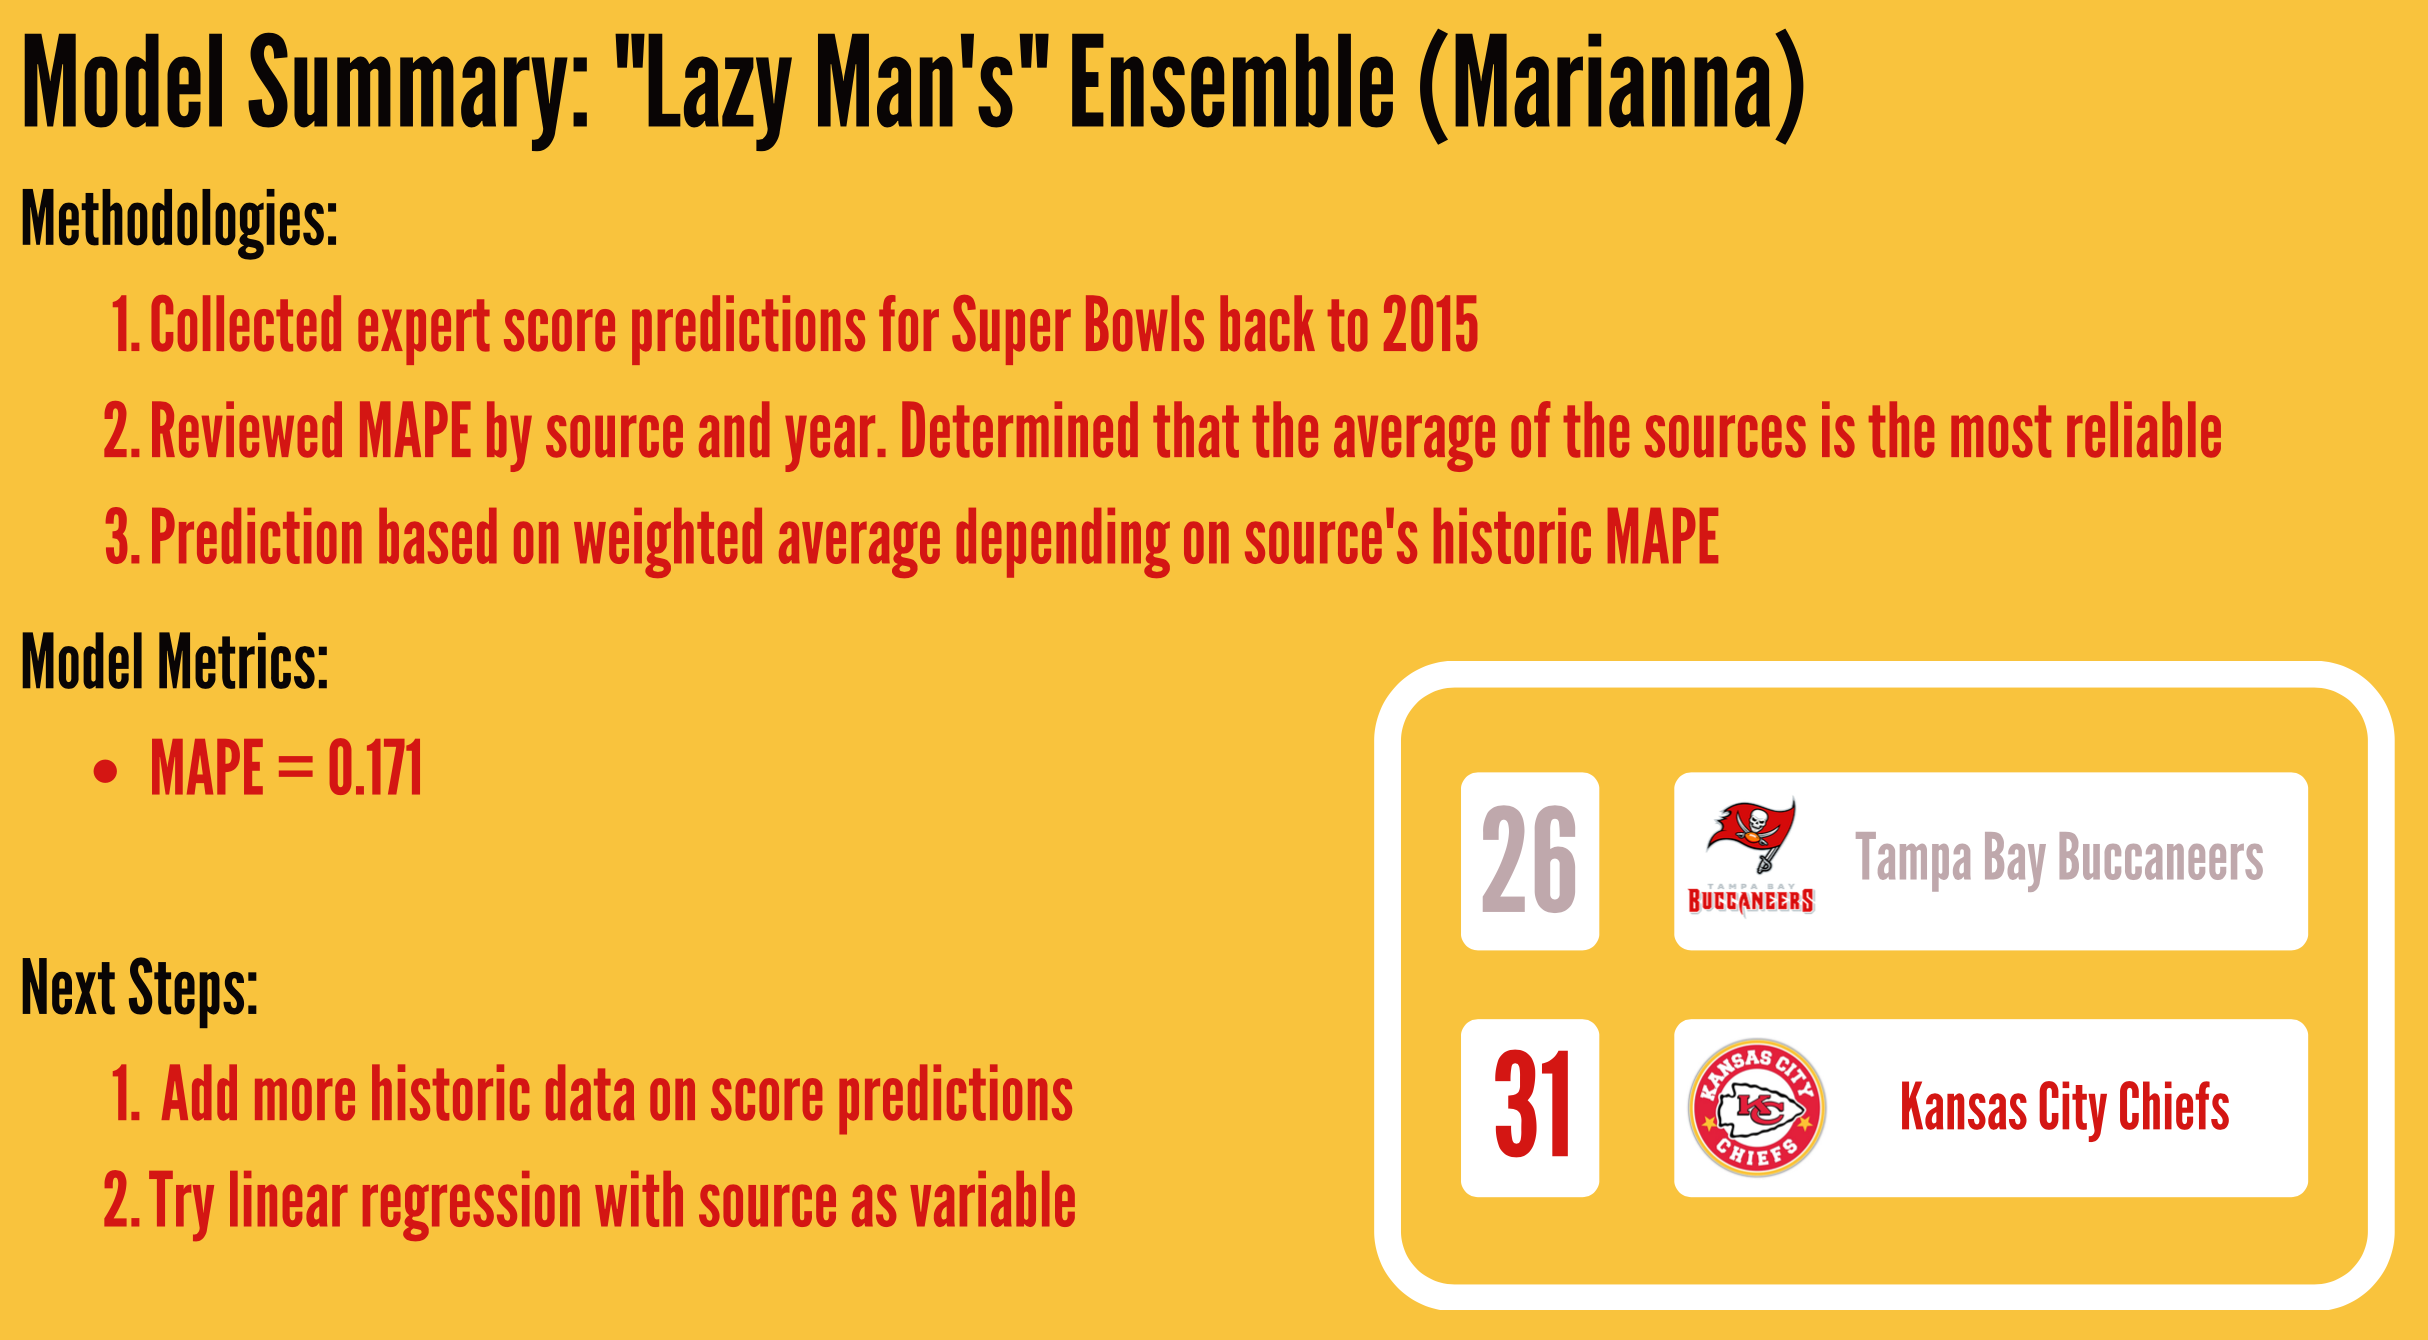
My third model was deemed a “lazy-man’s ensemble” where I collected historic predictions from football experts (ESPN hosts, Sportscenter analysts, etc.). I then calculated the MAPE by source (ESPN, Sportscenter, NFL, etc.) and used an ensemble calculation by MAPE. The outcome of this model was 31 to 26 Kansas City.
Our team then compiled our models together using an ensemble calculation weighted on MAPE scores. Our final prediction was 30 to 28 Kansas City.
Improvements: The project was purposefully assigned on a short timeline to emulate real-world requests. Given more time I would have investigated more variables to boost the r-squared of the first two Kansas City models. I also would have attempted ARIMA and ETS to predict in-game stats.
Technical skills: Stepwise regression, forecasting, feature creation
Tools: Alteryx, Excel
Team: Mira Daya, Karl Hickel, Ankit Jain, Allen Lee, Marianna Carini
Heart Disease Neural Network
Project overview: In this project, my group and I used neural networks to predict whether or not an individual has a cardiovascular condition based on their other health metrics. Due to the nature of the problem, our goal was to optimize recall. This way we would minimize misclassifying someone with heart disease at the expense of telling someone they have a heart disease when in fact they do not.
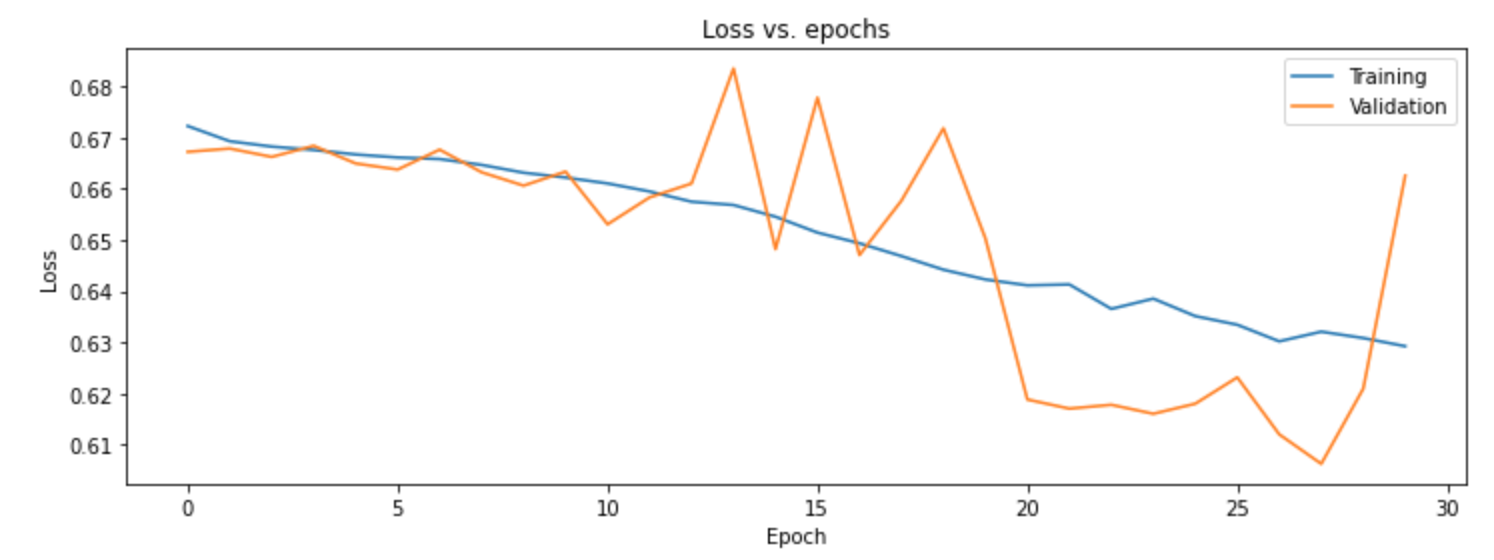
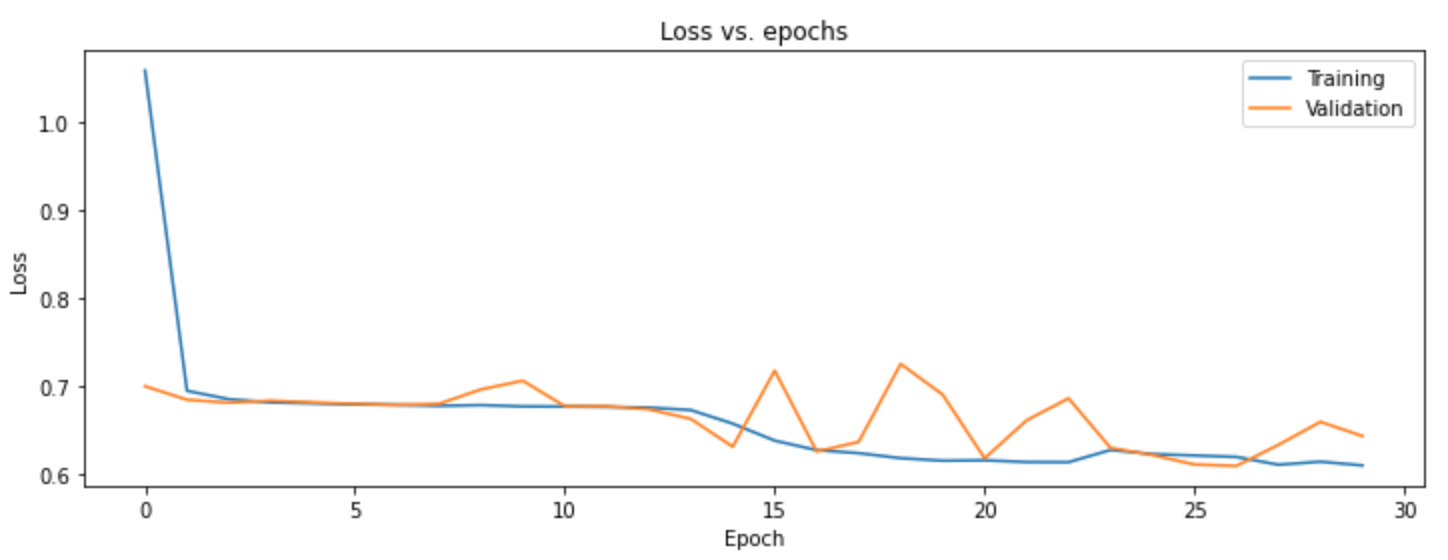
We looked to improve our model using a variety of parameter tuning. Our model did not improve when using different numbers of layers with various densities. Next, we tried different optimizers and numbers of epochs. Our model improved with RMS as the optimizer and worked best with 30 epochs. After we looked at various initializers and found RandomNormal worked the best with our data.
We did see evidence of overfitting, so we continued to test various hyperparameters. Varying dropout rates in different layers did not impact our recall much and actually increased our overfitting problem. Using both batch normalization and dropout regularization gave us the highest recall without overfitting and turned out to be our best model.
Technical skills: Tensorflow, neural network, deep learning
Tools: Google Collab, Python
Team: Karl Hickel, Matthais Ronnau, Caesar Phan, Marianna Carini
Spotify Network Analysis
Project overview: For this social analytics project, my team and I wanted to analyze the networks of popular musicians to identify any common themes. Our goal was to predict which songs will be popular based on the various audio features and the respective artist’s network structure. We used Spotify’s extensive API to gather our data. We defined a popular artist to be any artist with one or more songs with a popularity rating of 70 or more. We defined a connection to be when two artists collaborate on a song together.
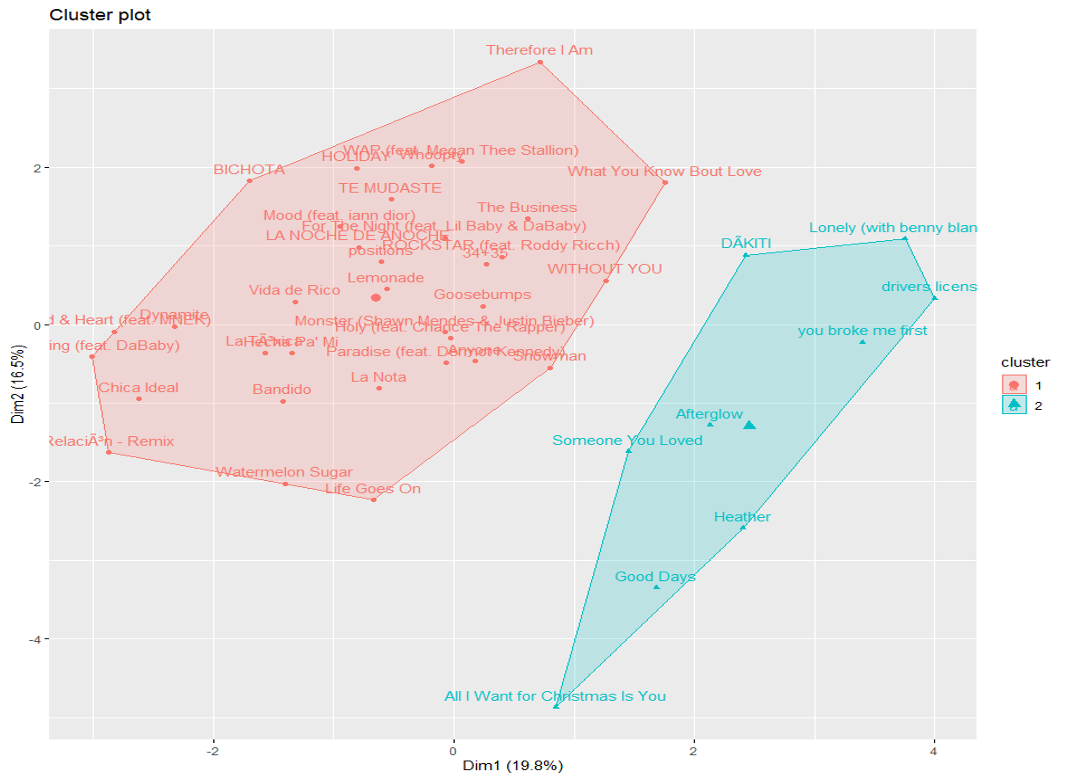
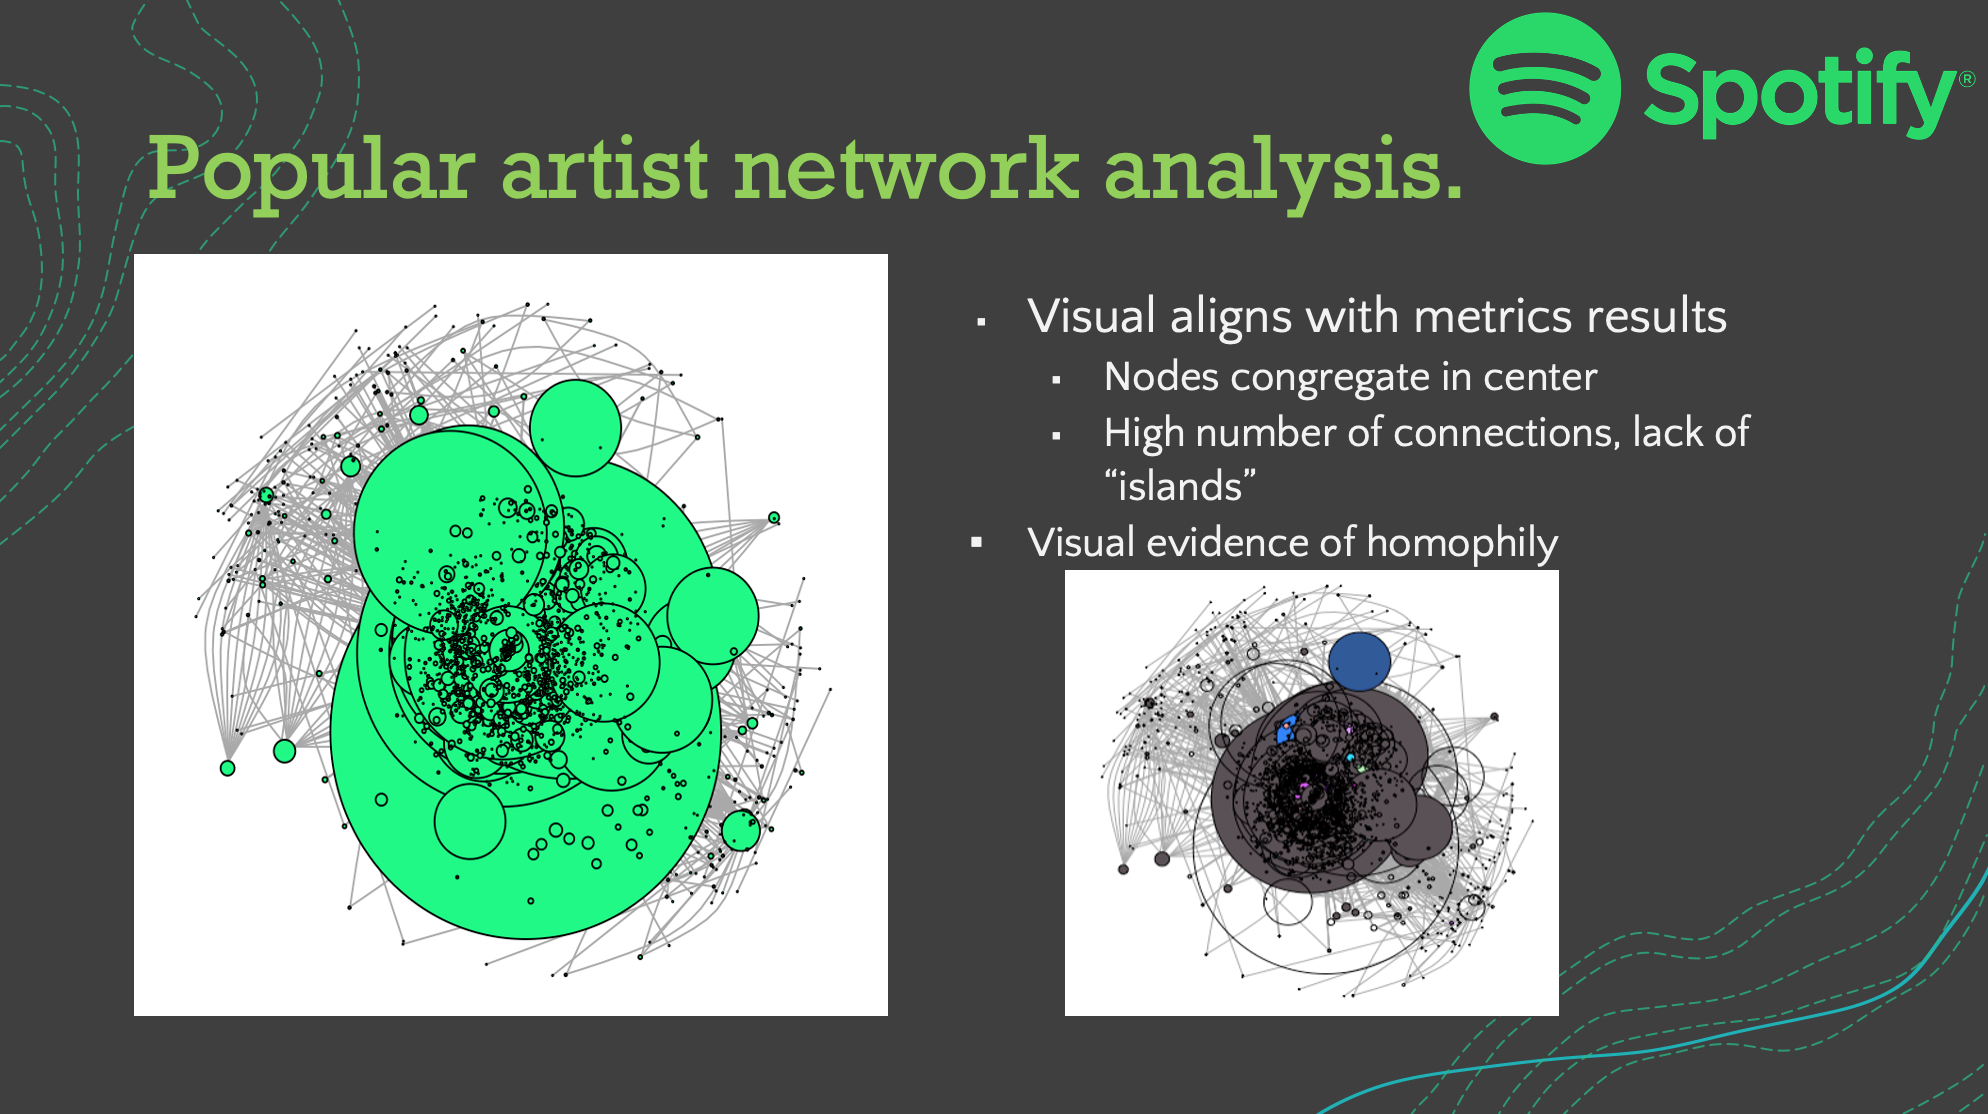
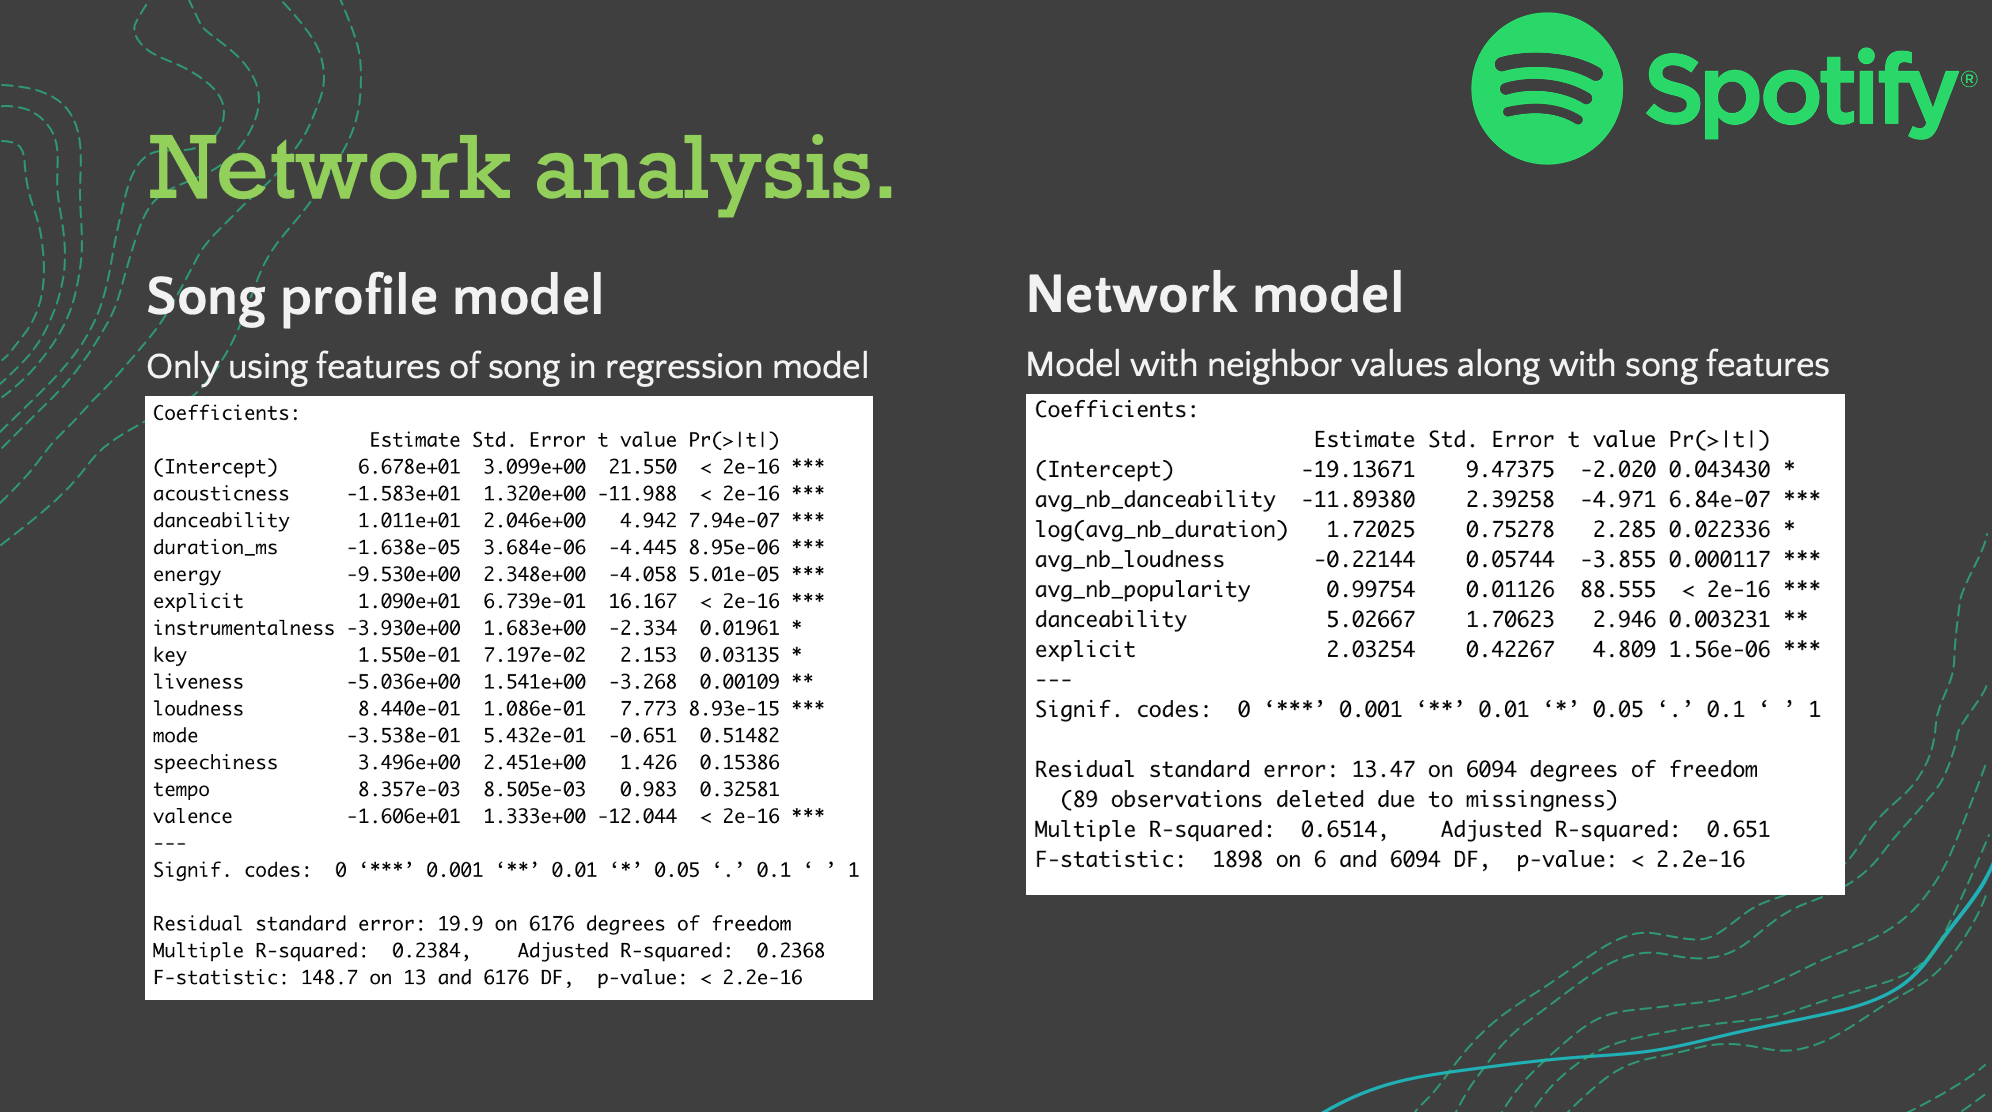
From our analysis we discovered three main insights. With the use of clustering we observed there are two distinct genres of popular songs, upbeat/party songs and slow-paced/serious songs. After constructing the network, we observed there are statistically significant differences in the closeness and betweenness of the popular artist network compared to the non-popular artist network. The popular artist community is a smaller circle (higher closeness) and is less likely to broker relationships different artists together (lower betweennesss). Lastly, we observed the network of an artist strongly impacts the success of their songs. From a basic regression model using only a song’s profile, we observed an R-squared of 0.238. When we included the average of the neighbors’ network values the R-squared increased to 0.651; thus showing the value of one’s network is linked with their popularity.
Technical skills: Network analysis, social analytics, regression, k-means clustering, API
Tools: R, igraph
Team: Salem Arthur, Eric Chen, Edward Shih-Chung, Marianna Carini
Nursing Home COVID-19 Risk Assessment
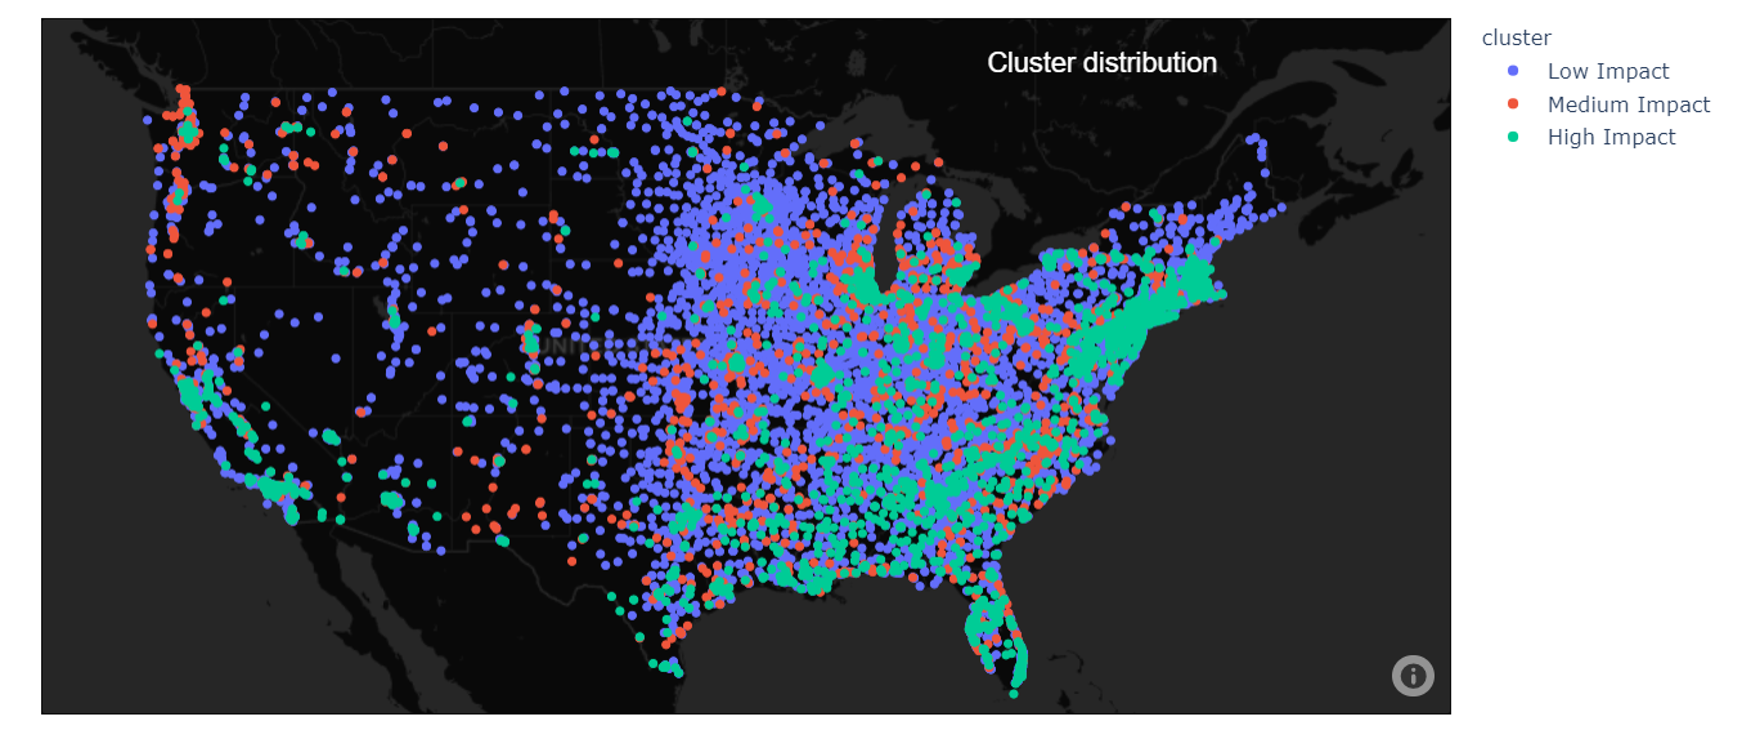
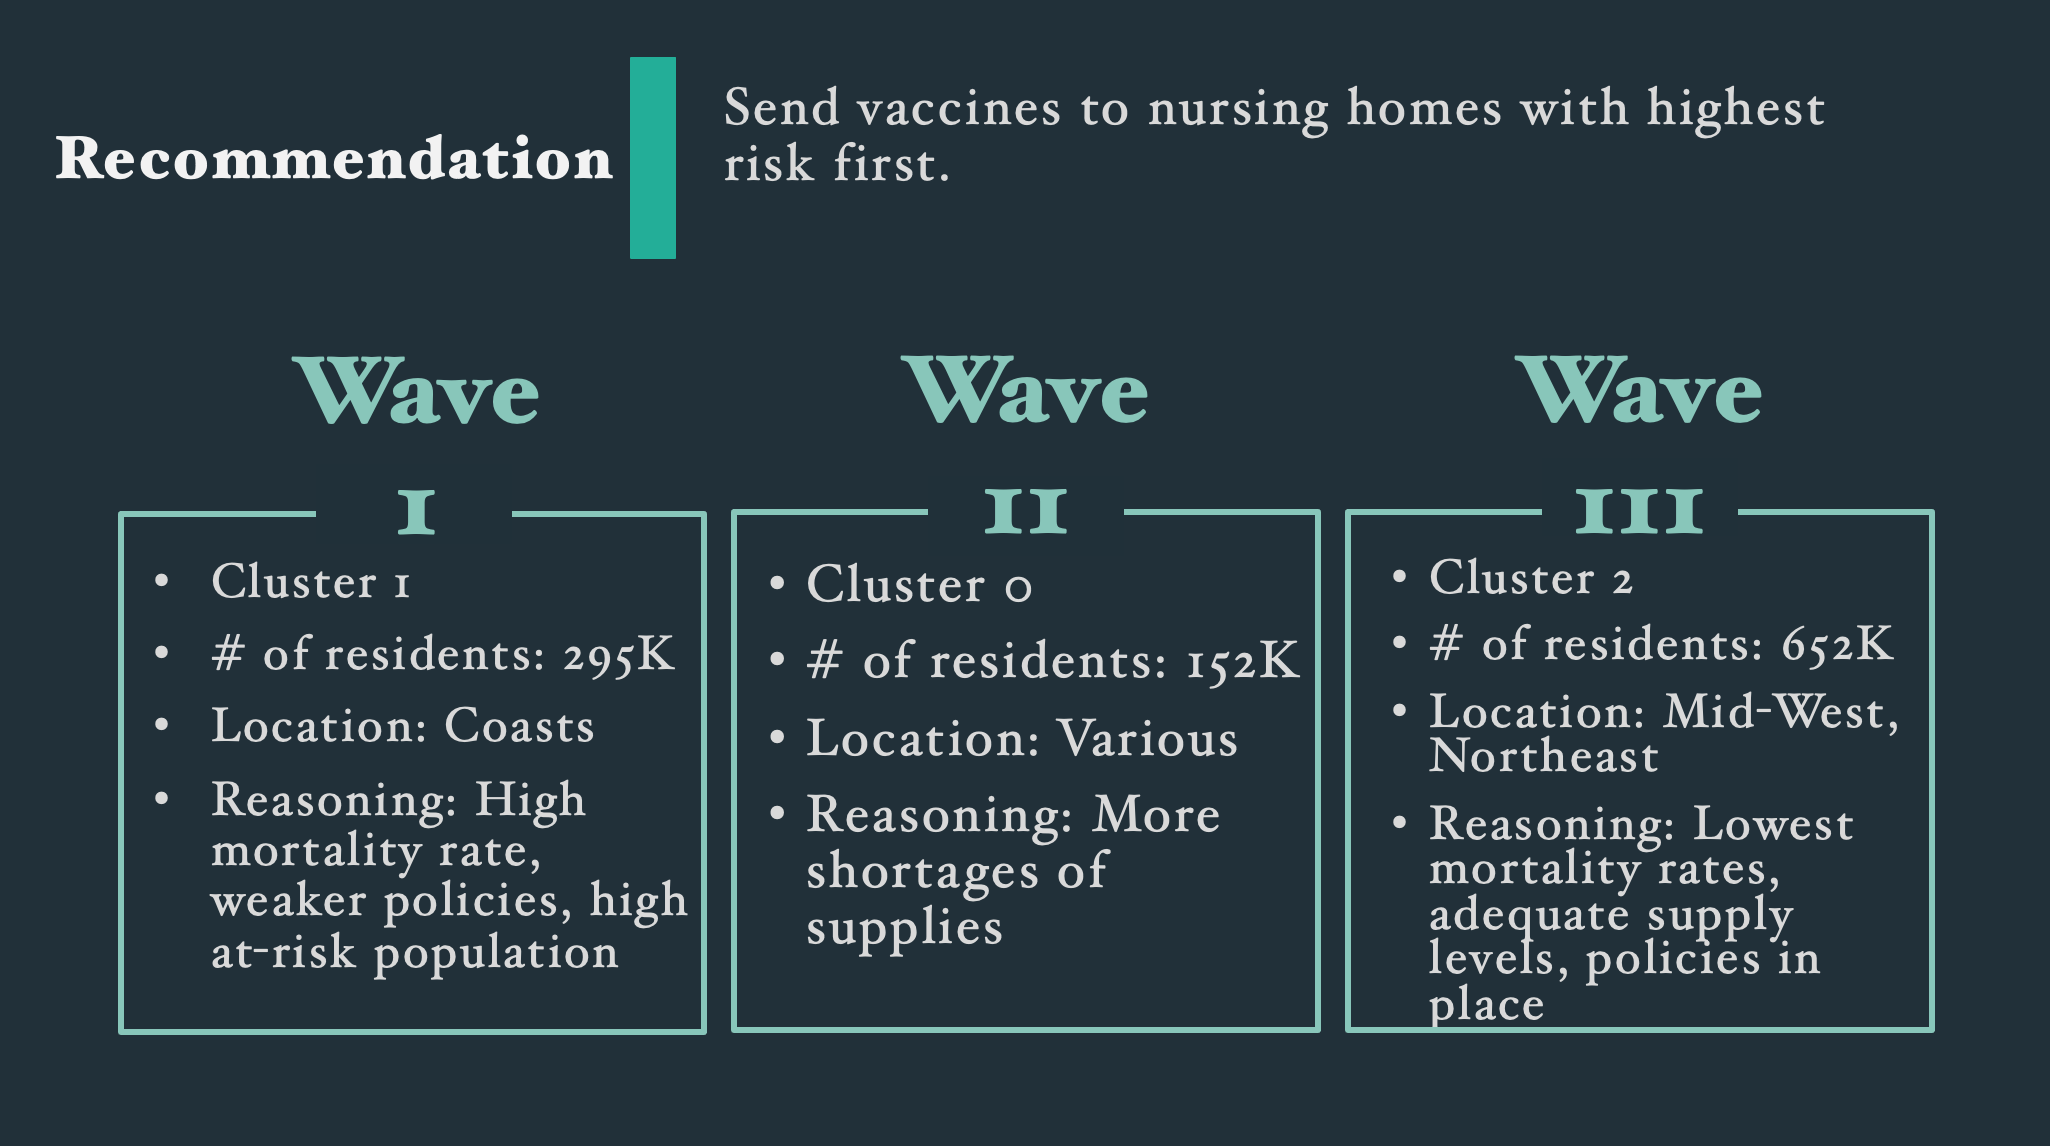
Project overview: On the heels of the COVID-19 vaccine approvals for Pfizer and BioNTech, our team utilized our machine learning techniques to protect the populations hardest hit by outbreaks, senior living facilities. We wanted to understand driving factors of COVID mortality and how best to distribute vaccines to senior citizens. We combined nursing home staff stats, nursing home supply stats, county census stats, and county COVID policy data to find trends with COVID mortality rates. Our group turned to k-means clustering to group like senior living facilities based on the mortality rates of COVID-19 at the time of analysis. Our clustering analysis came out with three distinct groups, deemed high, medium, and low impact.
We observed that the medium impact group experienced the highest amount of staffing and supply shortages but did not experience the highest mortality rates. Our data showed a higher percentage of the medium impact facilities were in areas implementing shelter-in-place and mask policies versus the other two clusters. The variance in the remaining policies was negligible between clusters. Conversely, the cluster with the highest mortality rates experienced similar shortages as the cluster with the lowest mortality rate. The highest mortality cluster was a more densely populated cluster, had the largest population of 65+, and had the highest population of civilians without health insurance.
From our analysis, we recommended sending the vaccines first to the high impact cluster because of their high mortality rates and high at-risk population. Next would be the medium impact cluster due to their shortage of supplies. Lastly would be the low impact cluster because of their low mortality rate. Once a plan was developed, communicating that plan would be key to avoiding the same issues we saw with the H1N1 vaccine distribution.
Technical skills: K-Means Clustering, API
Tools: Python
Team: Eric Chen, Allen Lee, Hyoungmin (Stella) Lee, Smitha Kannanaikkal, Marianna Carini
H1N1 Vaccine Demand Prediction
Project overview: At the time of this project, the Pfizer and BioNTech vaccines were recently approved for distribution. Our team wanted to study the H1N1 vaccine data to ultimately gain insight into the demand for COVID-19 vaccines. Our dataset was provided by the National Center for Immunization and Respiratory Disease as a apart of a DrivenData competition. The data detailed patient demographics, behaviors, opinions, health stats, and whether or not they received the vaccine.
We built models using Naive Bayes, Decision Tree, and Random Forest algorithms. We created multiple variations of each using forward feature selection and oversampling, due to a class imbalance in our outcome variable (80% did not receive a vaccine). We balanced the cost of manufacturing a vaccine that went unused versus the cost of a customer not receiving a vaccine. Because of our class imbalance, F1-score would be our measure of success over accuracy. Ultimately, the Naive Bayes model with oversampling and forward selection performed the best. Our other models experienced overfitting and/or low scores.

Improvements: If/when the NCIRD collects similar data for COVID-19, it would be interesting to study the similarities and differences in the H1N1 data. We would expect to see differences due to government mandates, but seeing the effect.
Technical skills: Naïve-Bayes, Decision Tree, Random Forest
Tools: WEKA, Python
Team: Eric Chen, Allen Lee, Hyoungmin (Stella) Lee, Smitha Kannanaikkal, Marianna Carini
Predicting Total Nitrate (NO3) in the Atmosphere
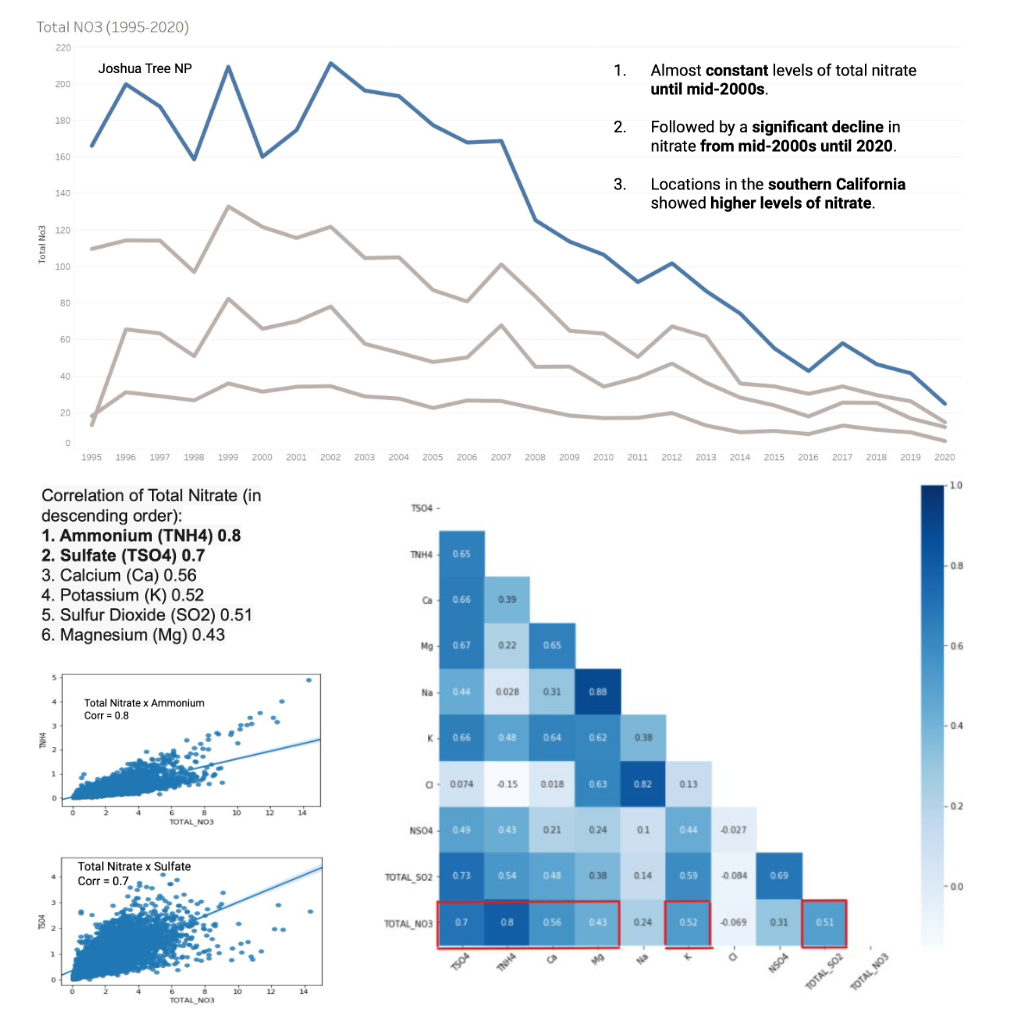
Project overview: This hackathon was hosted by the Data Science Go (DSGO) conference. Our team was provided time-series environmental data from the EPA on national parks in California. The goal was to garner insights into total nitrate levels.
Our group explored common environmental pollutants to find possible links between them and the total nitrate in the atmosphere. Among the pollutants, we found that ammonium and sulfate were associated with the strongest positive correlation to nitrate levels. Our project was awarded “Best Insights” for our in-depth exploratory data analysis and crisp presentation.
Improvements: Given more time, we would have looked into measuring and improving our model accuracy, along with any other algorithms. Ideally, we would also search for factors that correlate with nitrate levels which we can control (ex. number of park visitors).
Technical skills: Correlation, t-test, Gamma regression
Tools: Python, Tableau
Team: Ali Khan, Sasha Prokhorova, Marquise Piton, Marianna Carini
FoodAid Prototype
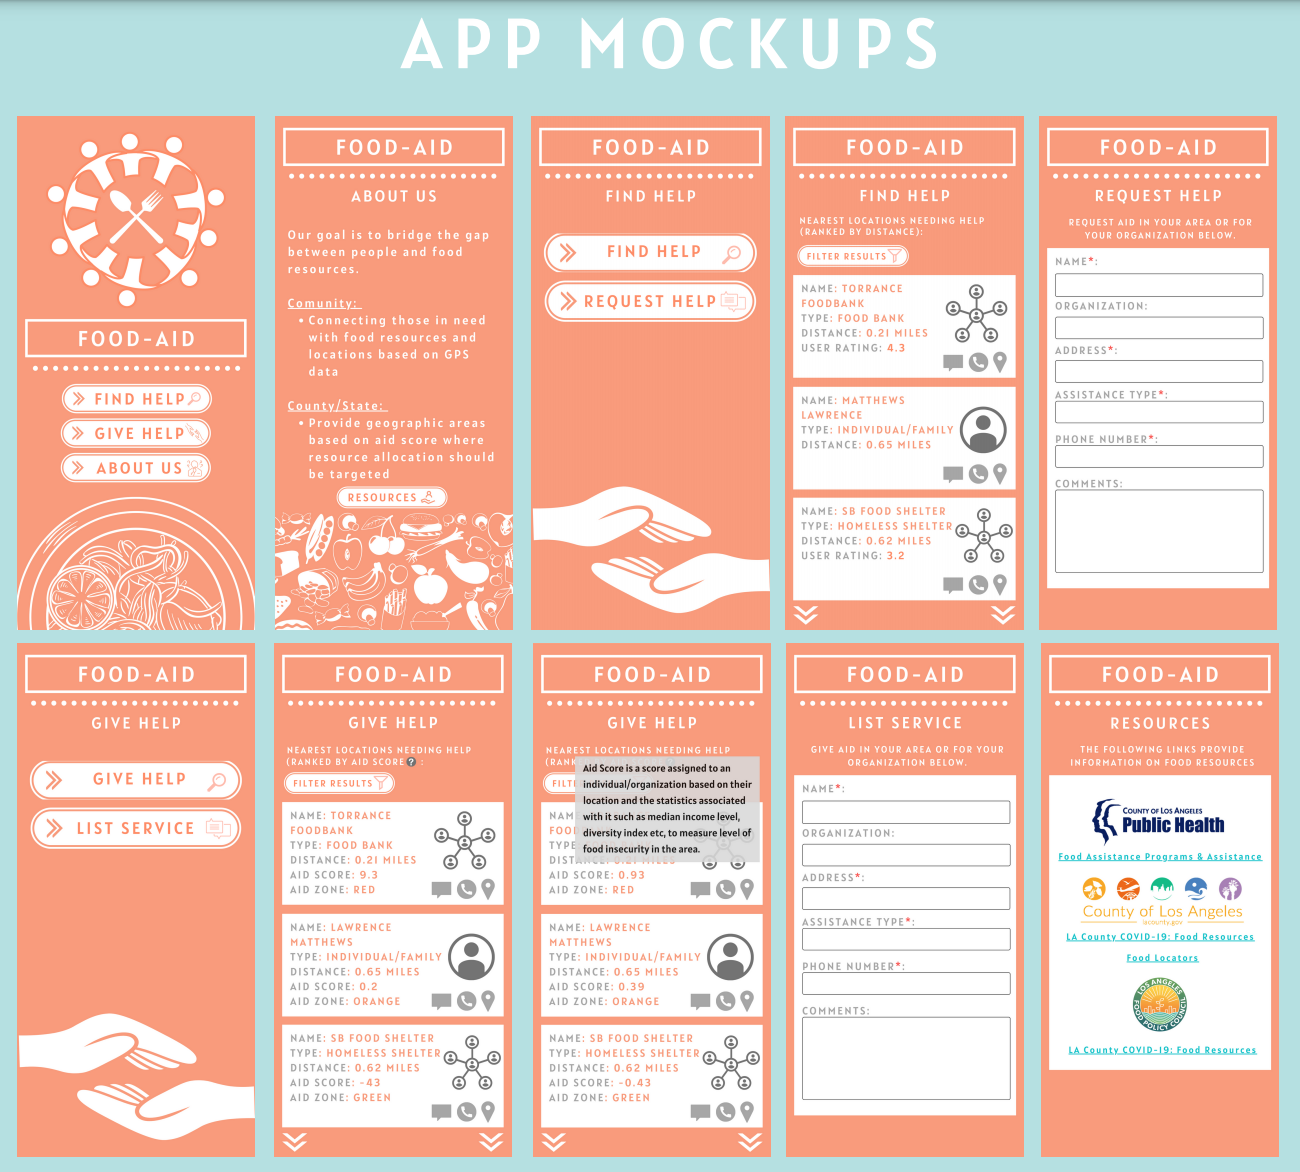
Project overview: This hackathon was put on by the City of Los Angeles and Data360. The goal was to use data to bridge the gap between those facing food insecurity and resources. My group consisted of my peers from the UCI MSBA program.
Our group set out to leverage data to spread awareness about food insecurity and destigmatize getting help. In a few short hours we created a UI that included a food aid score to easily show providers which areas needed more help than others, a feature where users could find help, and a feature where individuals and/or organizations could create a post to offer help. The food aid score was a calculation based on median income, race, population under the poverty line, and the unemployment rate all at a census tract level. The higher the score the more aid was needed. A score of zero reflected about average need and a negative score meant that tract was more likely to be able to provide support. This was intended to not only spread awareness, but allow established non-profits see what neighborhoods to reach out to.
After presenting to the judges, our team was awarded best overall project and the opportunity to work on our project further with the City of Los Angeles.
Tools: Python, R
Team: Mira Daya, Ankit Jain, Smitha Kannanaikal, Marianna Carini
Page template forked from evanca


